
Question 1:
Graphs play an important role in scientific investigations.
(a) What are the uses of graphs?
(b) Explain the main steps taken in the process of plotting a graph.
Answer:
(a)
– To interpret the relationship between two given variables.
– To determine the physical quantities represented by the gradient of the graph.
– To determine the physical quantities represented by the area under the graph.
– To determine the value of a physical quantity using interpolation.
– To make a prediction through extrapolation.
(b)
1. Determine the quantities represented the both axes. If we are asked to draw a graph of p against q, then p must be the vertical axis and q must be the horizontal axis.
If no instruction is given, then the horizontal axis is always the manipulated variable whereas the vertical axis is always the responding variable.
2. Label both axes with the correct quantity, together with the correct unit.
3. Choosing suitable scales for both axes.
For example: (1 cm: 1 × 10n/ 2 × 10n/ 5 × 10n)
4. Plot all the points on the graph. The points must cover a least half of the graph paper.
5. Draw a smooth line with a line of best fit.
– Distribution of the points are balance between the 2 sides of the graph line.
– All the points must be as close to the line as possible.
Question 2:
Figure 1.13 shows a graph obtained from a study to investigate the relationship between volume, V and temperature, θ of a fi xed mass of gas. Based on the graph given in Figure 1.13, answer the following questions.
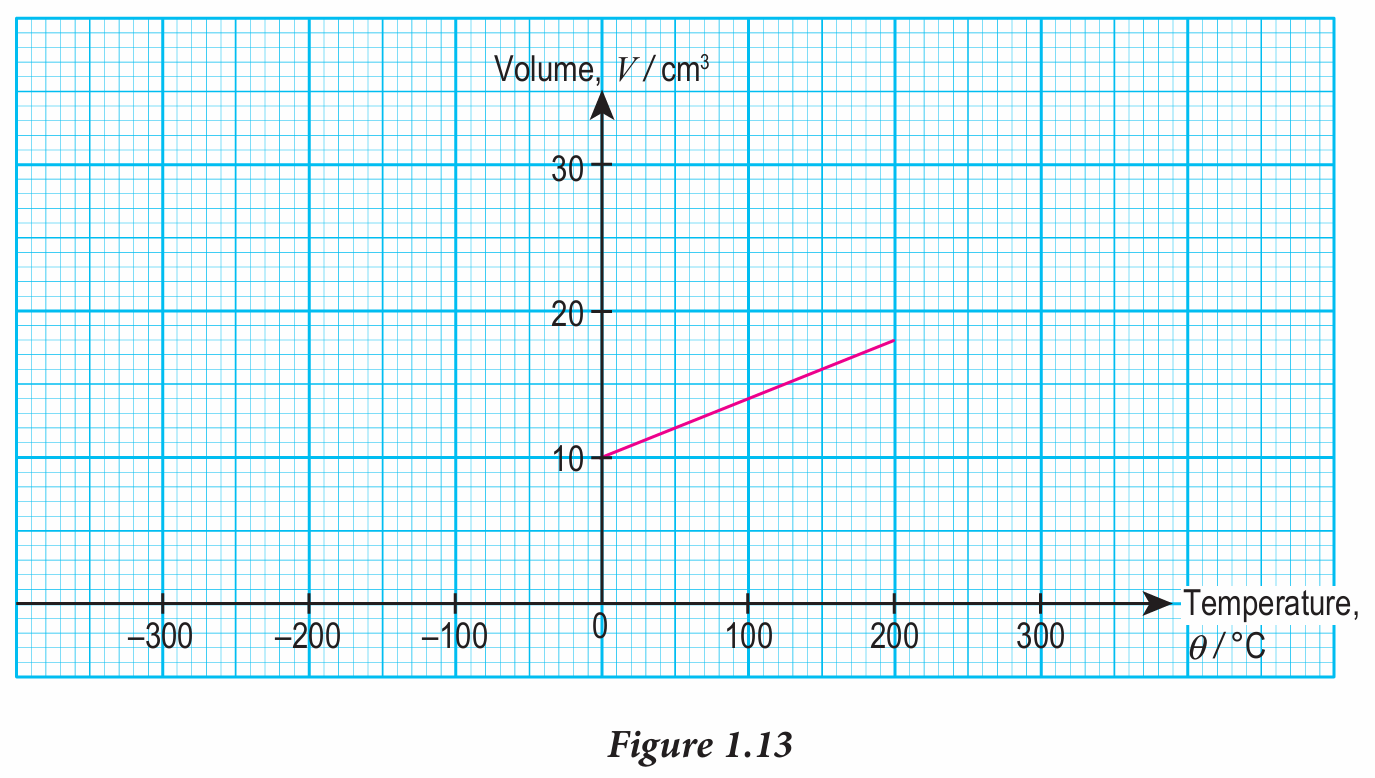
(a) What happens to V when θ increases?
(b) Determine the value of θ when the volume is zero. Show on the graph, how you determine the value of θ.
(c) Determine the value of V when θ = 300ºC. Show on the graph, how you determine the value of V.
Answer:
(a) V will increase at a constant rate when θ increases.
(b)
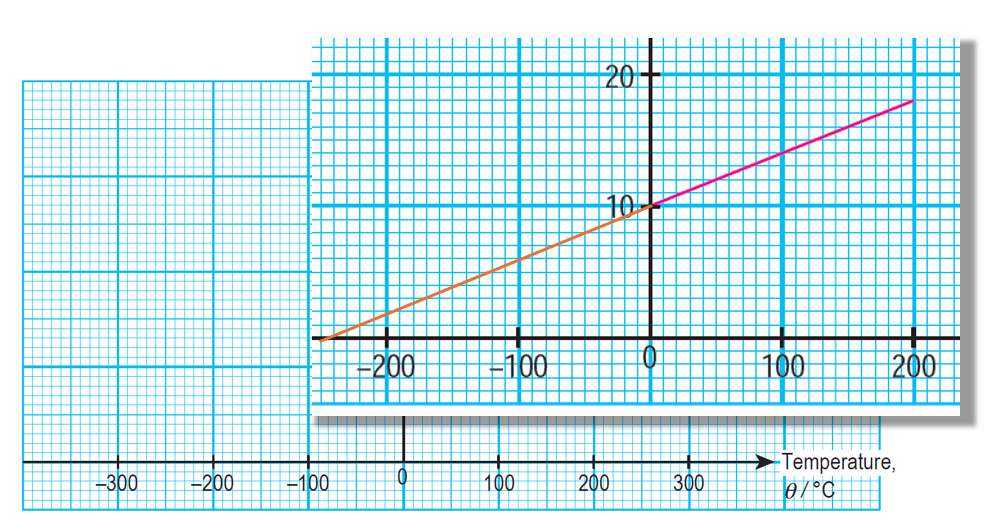
-240oC
Figure 1.13 shows a graph obtained from a study to investigate the relationship between volume, V and temperature, θ of a fi xed mass of gas. Based on the graph given in Figure 1.13, answer the following questions.
(a) What happens to V when θ increases?
(b) Determine the value of θ when the volume is zero. Show on the graph, how you determine the value of θ.
(c) Determine the value of V when θ = 300ºC. Show on the graph, how you determine the value of V.
Answer:
(a) V will increase at a constant rate when θ increases.
(b)
-240oC
(c)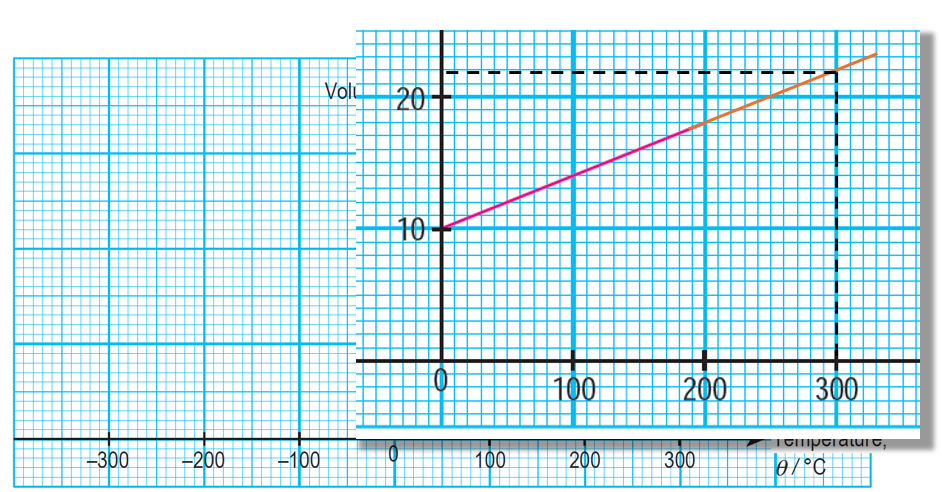
22 cm3