- A ticker-tape timer consists of an electrical vibrator which vibrates 50 times per second.
- This enables it to make 50 dots per second on a ticker-tape being pulled through it.
- The time interval between two adjacent dots on the ticker-tape is called one tick.
- One tick is equal to 1/50 s or 0.02 s.
Example:
Find the number of ticks and the time interval between the first dot and the last dot on each of the ticker tapes below. The frequency of the ticker timer is equal to 50Hz.
a.
b.
c.
Answer:
a. Number of ticks = 15, time interval = 15 x 0.02s = 0.3s
b. Number of ticks = 5, time interval = 5 x 0.02s = 0.1s
c. Number of ticks = 8, time interval = 8 x 0.02s = 0.16s
The distance between dots on a ticker tape
- The distance between two adjacent dots on a ticker-tape represents the displacement of the object in a tick (0.02 s).
- If the object moves quickly, the dots are far apart. If the object moves slowly, the dots are close to each other.
- The figure below shows the ticker-tapes produced by a fast and a slow-moving object.

Ticker-tape charts
- We can construct a ticker-tape chart by cutting the ticker-tape into length with an equal number of dots on each length and sticking the length side by side on a graph paper, in the same order that they were on the whole tape.
- The diagram below shows an example of a ticker-tape chart. There are 10 ticks on each length. This means that each length represents a time interval of 0.2s.
- Ticker-tape charts are very useful in analyzing the motion of an object.
Analysing Ticker Tape
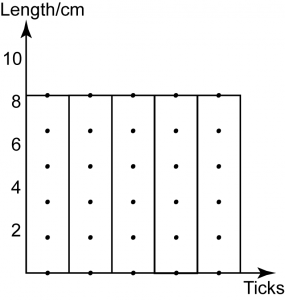
Uniform Velocity


 The distance of the dots is equally distributed.
- All lengths of tape in the chart are of equal length.
- The object is moving at a uniform velocity.
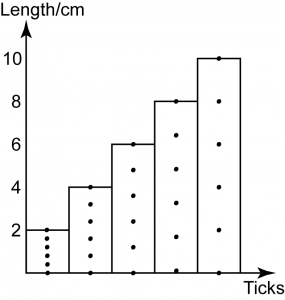
Uniform Acceleration


The distance between the dots increases uniformly.
- The length of the strips of tape in the chart increase uniformly.
- The velocity of the object is increasing uniformly, i.e. the object is moving at a constant acceleration.
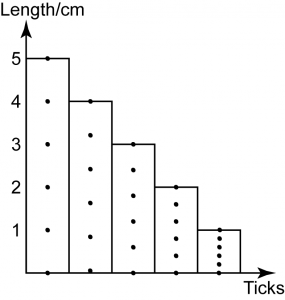
Uniform Deceleration


The distance between the dots decreases uniformly.
- The length of the strips of tape in the chart decreases uniformly.
- The velocity of the object is decreasing uniformly, i.e. the object is decelerating uniformly.


